

Have you heard of Fibonacci? he died a thousand years ago, but left the world a gift. The Golden Ratio has been used by Di Vinci to create the 'Mona Lisa' and Salvador Dali to paint 'The Sacrament of the Last Supper'. Human biologists use it to study the anatomy and the natural world, and as of August 2023, it's being used to predict the final Bitcoin price at the end of this bull-run. This might sound like nonsense, but when trading, the charts don't lie, and you'll never guess what the charts are screaming when you apply Fibonacci's sequence.
Background

Fibonacci (1170 – 1240) also known as Leonardo Bonacci, was an Italian mathematician in Pisa, Italy, considered to be "the most talented Western mathematician of the Middle Ages".
The name he is commonly called, Fibonacci, was made up in 1838 by the historian Guillaume Libri and is short for filius Bonacci ('son of Bonacci'). However, even earlier, in 1506, a notary of the Roman Empire, Perizolo mentions Leonardo as "Lionardo Fibonacci"
The Liber Abaci was a manuscript Fibonacci wrote in 1202, introducing the so-called Modus Indorum (method of the Indians), today known as the Hindu–Arabic numeral system.
With ten digits including a zero and positional notation, the book showed the practical use and value of applying the numerals to commercial bookkeeping, converting weights and measures, calculation of interest, money-changing, and other applications.
The book was well-received throughout educated Europe and had a profound impact on European thought. Replacing Roman numerals - it's ancient Egyptian multiplication method - and using an abacus for calculations. This was an advance in making business calculations easier and faster, which assisted the growth of banking and accounting in Europe.
The original 1202 manuscript isn't known to exist any longer. However, a 1228 copy of the manuscript does. The first section introduces the numeral system and compares it with others, such as Roman numerals, and methods to convert numbers to it. The second section explains uses in business, for example converting different currencies, and calculating profit and interest, which were important to the growing banking industry. The book also discusses irrational numbers and prime numbers.
Fibonacci Sequence
Fibonacci became aware of the sequence that Indian mathematicians had been using since 600BC, nonetheless, he was the first to develop it for the new European world. He then discovered the Golden Ratio and created extensions to the sequence, offering a mathematical equation that has been used ever since.
In mathematics, the Fibonacci sequence is a sequence in which each number is the sum of the two preceding ones. Numbers that are part of the Fibonacci sequence are known as Fibonacci numbers, commonly denoted Fn, something you can still see on calculators today .
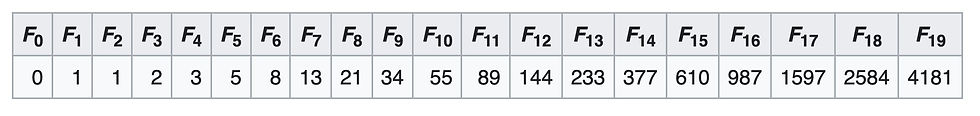
1+2 = 3
8+13 = 21
89+144 = 233
What’s really fascinating, however, is that the ratio of one number to its previous number is always: 1.618
233/144 = 1.618
89/55 = 1.618
55/34 = 1.618
Conversely, the ratio of one number to the next is: .618
144/233 = .618
55/89 = .618
34/55 = .618
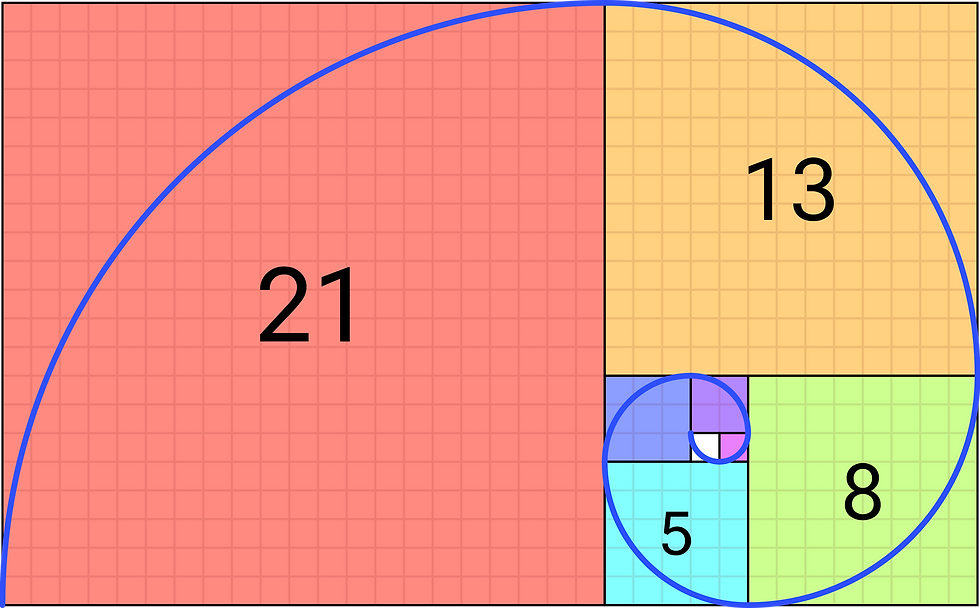
These ratios together are known as “The Golden Ratio”. Here you can see the Fibonacci Spiral which shows how mathematics and the Golden Ratio shapes natural beauty. The Ratio is also used frequently in technical analysis of stocks and maybe now cryptocurrency.
Fibonacci Extensions
The Fibonacci extension levels are derived from this same number string. If you divide one number by the prior number, you get a ratio 1.618, such as dividing 233 by 144. Divide a number by two places to the left and the ratio approaches 2.618. Divide a number by three to the left and the ratio is 4.236.
Fibonacci extensions are commonly found at 1.236, 1.382, 1.618, 2.272, 2.618, 4.236.
The 100%, 150% & 200% levels are not official Fibonacci numbers, but they are useful since they project solid numbers which traders tend to like.
Fibonacci extensions are a way to establish price targets or find projected areas of support or resistance. When the price is moving into an area where other methods of finding support or resistance are not applicable or evident we use a Fib Range.
How is the Golden Ratio relevant in the world?
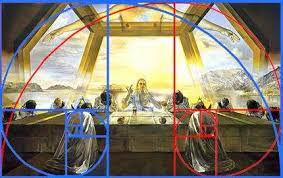
The Golden Ratio was used in Salvador Dali’s famous painting “The Sacrament of the Last Supper.”
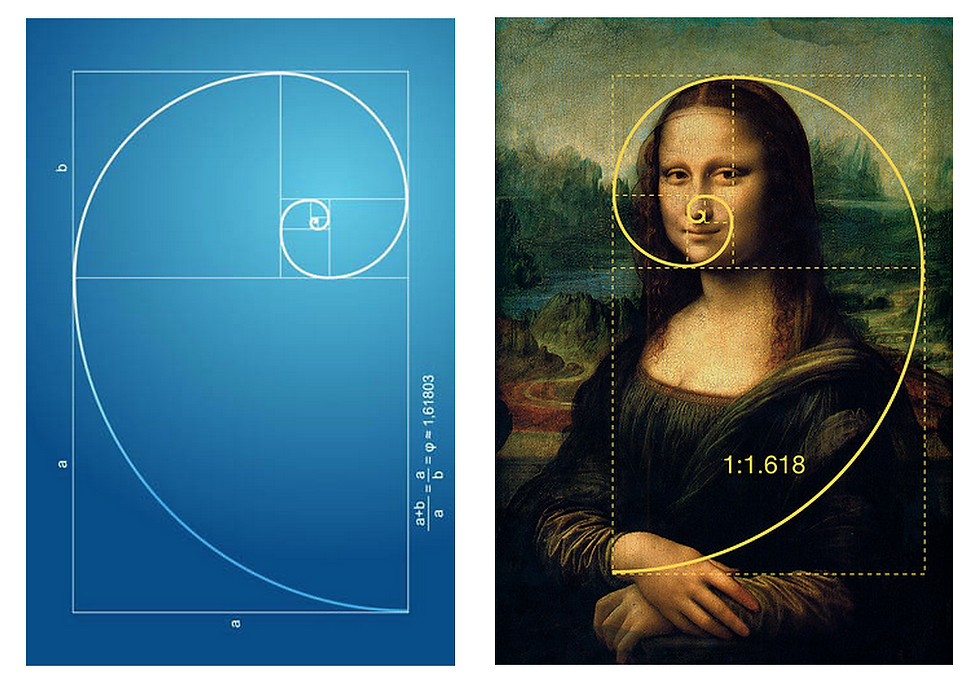
Leonardo da Vinci was said to be a huge admire of Fibonacci and his “Mona Lisa” and “Vitruvian Man” are both believed to have been structured with the Golden Ratio, as the ratio is generally seen as being aesthetically pleasing.
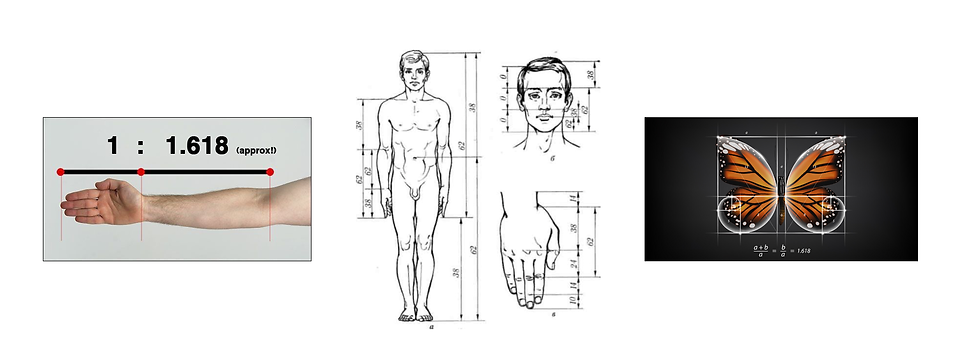
There are many examples of the Golden Ratio evident in the human body, in the arms, hands, face, fingers and toes. Theres even examples of it in nature.
How does all this relate to Crypto?
I applaud you is you've made it this far. I know what your thinking "all this is extremely cool and definitely not boring mathematics, I can't wait to dazzle my friends at the next party", but how does this all relate to chart analysis?
Well, the Fibonacci sequence and extensions are used to describe predictable patterns in investment prices. The financial markets seem to use the Fib Ranges to maintain balance in the markets and to identify situations where variances from the normal patterns may identify buying or selling opportunities.
Simply put, the Golden Ratio can be used to understand investor psychology. Dima Vonko wrote in Investopedia saying:
"In many cases, it is believed that humans subconsciously seek out the Golden Ratio. For example, traders aren’t psychologically comfortable with excessively long trends. Chart analysis has a lot in common with nature, where things that are based on the golden section are beautiful and shapely and things that don’t contain it look ugly and seem suspicious and unnatural. This helps to explain why, when the distance from the golden section becomes excessively long, the feeling of an improperly long trend arises.”
Here are some examples of how Fibonacci analysis is used in predicting Bitcoin price movements and cycles:
After a mid-cycle price run, Bitcoin usually sees a retracement to the price level of .618 times the high number. Then finds support at that level, and then the next step of a bull market can unfold.
When Bitcoin’s price hits 1.618 times its 350-day moving average, it meets resistance and usually must pull back a bit before beginning its next leg up.
Fibonacci sequence numbers 13, 8, 5 and 3 have indicated the top of Bitcoin’s market cycles as follows:
350-day moving average X 13 = 2013 market top.
350-day moving average X 8 = 2014 market top (end of cycle)
350-day moving average X 5 = 2017 market top. (end of cycle)
350-day moving average X 3 = 2021 market top. (end of cycle)
Self for filling prophecy
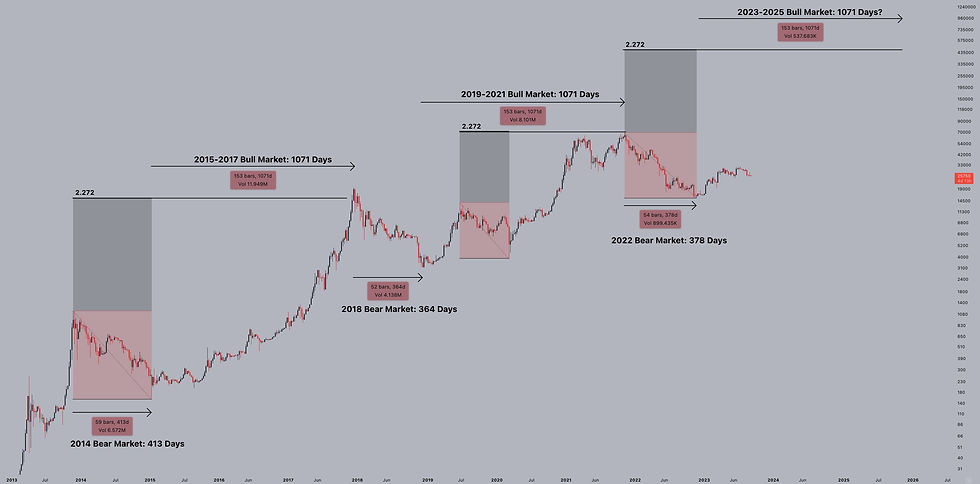
This chart was posted in August 2023 by Jelle on Twitter and it got a loads of abuse. It declares that a single Bitcoin will see a $1 million valuation at the end of this cycle. Something none of the famous analysts are predicting. Their range of all time highs are from $95,000 - $225,000 and even the highest of their predictions are getting ridiculed.
So I decided to take a look at the chart. Applying what I knew about Fibonacci as the basis of this prediction.
The chart displays the last 2 bull runs and last 2 crypto winters. It details the number of days between each event and the correlation between each cycle, which is when it got interesting.
According to this chart, last two bull markets were precisely 1071 days in length and both topped at the Fibonacci Extension of 2.272 from the bottom of the cycle. This means that if this cycle repeats for a third time in October 2025, we might be looking at a $980,000 Bitcoin.
The reason why this is so interesting is because crypto is speculating, not trading. We aren't betting on a product launch or an new government contract being signed. We are betting on human nature and the charts, or what i like to call it... (insert dumb voice) "urh...what happened last time?".
If everyone knew that each of the previous bull runs had been precisely 1071 days long, no one would buy crypto tokens on day 1072 because they know the market is over and it's only downhill from here. Which in turn would make the market collapse faster. It becoming a self for filling prophecy.
So if we are speculating with absolutely no tangible evidence, why should we believe the so called experts and ignore a mathematical genius that influenced Leonardo Di Vinci?
Other charts and other analysis will point to other ranges and other trends, but imagine, just for one second, with the Bitcoin Spot ETF and now Fidelity and Arc's Ethereum Spot ETF added to the S.E.C. losing to XRP/Ripple and tokens becoming commodities, just imagine if the Fibonacci extension is right, it would change the world forever.
Disclaimer - None of what is written on this website is financial advice and only descriptions of how the author trades and for entertainment purposes.
留言